All of the talk today has been over the recent unemployment numbers. The unemployment rate fell from 8.1% to 7.8% and employment increased by 873,000. With these numbers came the conspiracies (google Jack Welch). Without going into a lot of details about the conspiracies, I'm going to post two graphs that will hopefully end this debate. Here is the first graph that simply compares month-to-month change in employment reported by the household survey.

First thing one is likely to notice is the considerable noise in the data. The next thing you will likely notice is the spike that occurred in January of 2000. During this month the economy added 2 million jobs. In fact you will likely notice that April of 1960 and January of 1990 also included large spikes in employment. In 2012 there were two employment spikes, the first in February (went largely unnoticed) and then in September. The economy added 847,000 and 873,000 jobs, respectively. These number also compared to those posted in 1983. In June of 1983 the economy added 991,000 jobs and the May of 1984 added another 857,000. Both 2012 and 1983-4 are very similar in that they follow large periods of declines in the employment numbers.
Here is a table showing the months with the most change in employment levels:
| Month | Change in Employment |
| 2000-01-01 | 2036 |
| 1960-04-01 | 1286 |
| 1990-01-01 | 1251 |
| 1983-06-01 | 991 |
| 2003-01-01 | 991 |
| 1948-06-01 | 889 |
| 2012-09-01 | 873 |
| 1984-05-01 | 857 |
| 1950-04-01 | 855 |
| 2012-01-01 | 847 |
| 1959-12-01 | 811 |
| 1950-08-01 | 796 |
| 1973-02-01 | 751 |
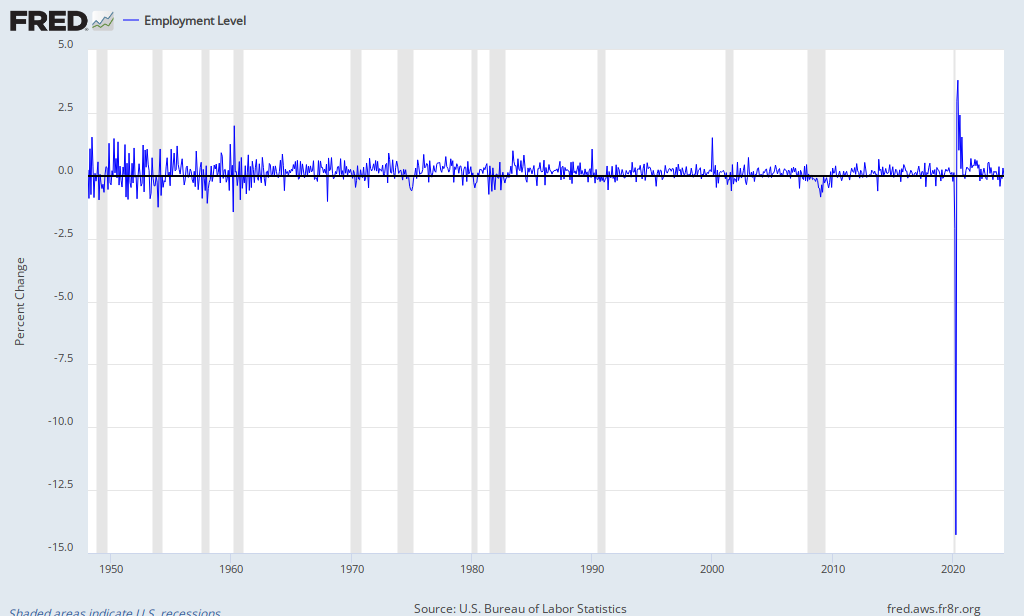
In the second graph, we are simply looking at the percent change in the employment numbers relative to the previous month. Here we see that the two months in 2012 saw employment increase by a little more than 0.6%. Relative to history, there are 48 months in the last 65 years that had a faster growth in the employment numbers. Compared to 1983 these numbers are considerably lower. In 1983-4 the two months added employment at rates of 0.82% and 1%. Conspiracy? Doubtful.
| Month | % Change in Employment |
| 1960-04-01 | 1.988465047 |
| 1948-06-01 | 1.536626681 |
| 2000-01-01 | 1.513495833 |
| 1950-04-01 | 1.481083703 |
| 1950-08-01 | 1.349129676 |
| 1949-11-01 | 1.292147584 |
| 1959-12-01 | 1.256779792 |
| 1951-03-01 | 1.240341261 |
| 1952-09-01 | 1.222612477 |
| 1955-07-01 | 1.184830288 |
| 1951-12-01 | 1.104686142 |
| 1948-04-01 | 1.075063724 |
| 1954-02-01 | 1.06457417 |
| 1990-01-01 | 1.061699058 |
| 1953-01-01 | 1.059815599 |
| 1955-01-01 | 1.059618072 |
| 1952-11-01 | 1.024412958 |
| 1983-06-01 | 0.994560527 |
| 1957-02-01 | 0.982210209 |
| 1959-03-01 | 0.915457572 |
| 1955-04-01 | 0.903812086 |
| 1973-02-01 | 0.903067544 |
| 1951-07-01 | 0.899027172 |
| 1964-04-01 | 0.862382386 |
| 1976-01-01 | 0.848093233 |
| 1961-06-01 | 0.831181531 |
| 1984-05-01 | 0.821384757 |
| 1959-04-01 | 0.779560272 |
| 1977-11-01 | 0.761939561 |
| 1962-08-01 | 0.729509799 |
| 1960-11-01 | 0.72677962 |
| 2003-01-01 | 0.726401126 |
| 1968-05-01 | 0.722594989 |
| 1954-09-01 | 0.716756052 |
| 1953-06-01 | 0.716170373 |
| 1968-02-01 | 0.708165997 |
| 1971-07-01 | 0.695811166 |
| 1950-06-01 | 0.687138741 |
| 1969-02-01 | 0.679643252 |
| 1983-11-01 | 0.676212037 |
| 1955-12-01 | 0.675024108 |
| 1978-04-01 | 0.674370746 |
| 1962-02-01 | 0.650450778 |
| 1973-03-01 | 0.643531319 |
| 1973-06-01 | 0.634391834 |
| 1975-07-01 | 0.631480288 |
| 1964-02-01 | 0.620545319 |
| 1986-01-01 | 0.620056184 |
| 2012-09-01 | 0.614351764 |
| 1965-07-01 | 0.612460401 |
| 1972-01-01 | 0.606429645 |
| 1969-06-01 | 0.604557433 |
| 1984-02-01 | 0.603676321 |
| 1967-04-01 | 0.603221721 |
| 2012-01-01 | 0.601605228 |
No comments:
Post a Comment