In the next section we are going to discuss labor market concerns including the growing levels of income inequality. Here is a fun, interesting interactive graph from the NY Times. How well did you do? Why do you think you were off?
Thursday, May 28, 2015


Tuesday, May 19, 2015
Wednesday, February 26, 2014
News Headlines and the CBO Report on the Minimum Wage
Two weeks ago the CBO released their report analyzing the effects of raising the federal minimum wage to either $9.00 per hour or $10.10 per hour (you can read the report here). In short the results were mixed. Looking specifically at the increase to $10.10 per hour they found job losses to be approximately 500,000 (or about 0.3% of our total level of employment) with a 2/3 probability job loss will lie between slight decrease to a decrease of one million. On the flip side they found incomes for families below the poverty threshold would increase by $5 billion. Incomes would increase by $12 billion for family with income from one to three times the poverty threshold and another $2 billion for families with income four to six times the poverty threshold. Incomes will decline by $17 billion for families with income greater than six times the poverty threshold (you can see the poverty threshold here). On the net real income in the economy would increase by $2 billion (or 0.022% of total wage income). In regards to the increase to $9 per hour the net effects would be 100,000 jobs lost and a net increase of $1 billion in real income.
So the conclusion is not much of a conclusion. Increasing the minimum wage involves a tradeoff (a small one at that) do we sacrifice 500,000 jobs for a net increase of $2 billion in real income? Is it better to have more jobs or fewer, better paying jobs? Either way this provides further evidence that an increase in the minimum wage is not the answer to combat the rising levels of income inequality. The benefits of a higher minimum wages are far lower than those touted by liberals. But the costs are also significantly lower than those proclaimed by conservatives. Of course, neither party wants to admit that they are exaggerating the truth.
I did a google search on the phrase: CBO report on higher minimum wages, and was interested to see the message espoused by news organization. Here are screen shots of the headlines in order of conservative, liberal, and neutral:
Conservative commentary (I focused on articles that emphasized the negatives, i.e. job losses)


So the conclusion is not much of a conclusion. Increasing the minimum wage involves a tradeoff (a small one at that) do we sacrifice 500,000 jobs for a net increase of $2 billion in real income? Is it better to have more jobs or fewer, better paying jobs? Either way this provides further evidence that an increase in the minimum wage is not the answer to combat the rising levels of income inequality. The benefits of a higher minimum wages are far lower than those touted by liberals. But the costs are also significantly lower than those proclaimed by conservatives. Of course, neither party wants to admit that they are exaggerating the truth.
I did a google search on the phrase: CBO report on higher minimum wages, and was interested to see the message espoused by news organization. Here are screen shots of the headlines in order of conservative, liberal, and neutral:
Conservative commentary (I focused on articles that emphasized the negatives, i.e. job losses)
Liberal Commentary (I focused mainly on articles that emphasized the positives, i.e. income growth)
Neutral Commentary
Most mainstream new organizations reported relatively neutral headlines. I did not read each and every article and cannot comment on the content within each article. For the most part Fox News (perhaps most surprising), NY Times, CNN, WSJ, Washington Post, PBS, and Al Jazeera used neutral headlines. Whereas CNBC, FoxBusiness, Christian Science Monitor, News Max, NY Daily, Washington Times, The Hill, and Barrons lead with more conservative leaning headlines. Those with more liberal headlines were Huffington Post, Fiscal Times, NPR, and Politico.
Tuesday, April 16, 2013
Did Reinhart and Rogoff Get it Wrong?
Mike Konczal at the Next New Deal provides a thorough review of the work by Thomas Herndon, Michael Ash, and Robert Pollen, "Does High Public Debt Consistently Stifle Economic Growth? A Critique of Reinhart and Rogoff."
For a thorough review of the arguments you can turn to Mark Thoma or Tyler Cowen. If the RR paper were the only paper that showed a substantial slowdown in growth resulting from excessive levels of government debt, then yes, this a very concerning result. We should never place a large emphasis on one result. Fortunately, we didn't. The RR paper motivated a large literature and their results were found to be largely true by a number of other authors. Here are two key papers:
"The Real Effects of Debt" by Cecchetti, Mohanty, and Zampolli:
"The Impact of High and Growing Government Debt on Economic Growth. An Empirical Investigation for the Euro Area" by Checherita and RotherAt moderate levels, debt improves welfare and enhances growth. But high levels can be damaging. When does debt go from good to bad? We address this question using a new dataset that includes the level of government, non-financial corporate and household debt in 18 OECD countries from 1980 to 2010. Our results support the view that, beyond a certain level, debt is a drag on growth. For government debt, the threshold is around 85% of GDP. The immediate implication is that countries with high debt must act quickly and decisively to address their fiscal problems. The longer-term lesson is that, to build the fiscal buffer required to address extraordinary events, governments should keep debt well below the estimated thresholds. Our examination of other types of debt yields similar conclusions. When corporate debt goes beyond 90% of GDP, it becomes a drag on growth. And for household debt, we report a threshold around 85% of GDP, although the impact is very imprecisely estimated.
(Here is a similar published version)
These are two papers that come to mind that show supporting evidence in favor of the RR results. There are also papers that don't necessary support the RR hypothesis. Here is one that comes to mind are:This paper investigates the average impact of government debt on per-capita GDP growth in twelve euro area countries over a period of about 40 years starting in 1970. It finds a non-linear impact of debt on growth with a turning point—beyond which the government debt-to-GDP ratio has a deleterious impact on long-term growth—at about 90-100% of GDP. Confidence intervals for the debt turning point suggest that the negative growth effect of high debt may start already from levels of around 70-80% of GDP, which calls for even more prudent indebtedness policies. At the same time, there is evidence that the annual change of the public debt ratio and the budget deficit-to-GDP ratio are negatively and linearly associated with per-capita GDP growth. The channels through which government debt (level or change) is found to have an impact on the economic growth rate are: (i) private saving; (ii) public investment; (iii) total factor productivity (TFP) and (iv) sovereign long-term nominal and real interest rates. From a policy perspective, the results provide additional arguments for debt reduction to support longer-term economic growth prospects.
"Public Debt and Economic Growth. Is There a Casual Effect." by Panizza and Presbitero
The mistakes made in the Reinhart-Rogoff paper are concerning, but that find does not dismiss the results found by many other authors.This paper uses an instrumental variable approach to study whether public debt has a causal effect on economic growth in a sample of OECD countries. The results are consistent with the existing literature that has found a negative correlation between debt and growth. However, the link between debt and growth disappears once we instrument debt with a variable that captures valuation effects brought about by the interaction between foreign currency debt and exchange rate volatility. We conduct a battery of robustness tests and show that our results are not affected by weak instrument problems and are robust to relaxing our exclusion restriction.
Monday, October 15, 2012
Reinhart-Rogoff Effect
Carmen Reinhart has quickly become the top economist for understanding financial crises. Carmen is the most cited female economist. Lately she has focused her attention on the recovery following a financial crisis and economic growth in a period of debt (paper 1 and 2).
Today, she finds herself thrown into the political debate for her views on an economic recovery following a major financial disruption.
Here we are, five years after the collapse of the housing market. What have we learned? Reinhart and Rogoff were correct once again.
Ezra Klein has a nice write up here.
Today, she finds herself thrown into the political debate for her views on an economic recovery following a major financial disruption.
Rutgers University economic historian Michael Bordo and Cleveland Fed economist Joseph Haubrich studied just U.S. recessions going back to 1882 and found that U.S. recoveries following financial shocks tend to be rapid. Top economic advisers to Republican Mitt Romney have leaned on this research to argue that the culprit in the current slow recovery is Mr. Obama himself, not the financial crisis that preceded him. This line of research has taken issue with the Reinhart and Rogoff studies, arguing, among other things, that U.S. crises can’t be likened to financial crises that have happened elsewhere in the world — such as small developing markets – because their economic institutions are so different.When Barack Obama first took office he promised a quick recovery. We had just went through the largest financial disruption in over eighty years. Quick was not going to happen. Reinhart and Rogoff said so. In December of 2008 they posted, "The Aftermath of Financial Crises," in which they showed for major financial crises unemployment will remain above 7% for nearly five years. Why did Obama think this time would be different. It wouldn't be. Have we not learned anything?
Now Reinhart and Rogoff are firing back. In a short paper they released this weekend, they fire back at the Bordo work. They see several flaws. One of their main arguments is that the Bordo work includes borderline financial shocks which weren’t full blown crises. Reinhart and Rogoff argue that if the paper focused on the four full blown U.S. crises of the past 150 years – in 1873, 1893, 1907 and the 1930s – they would get results similar to the broad swath of international crises the Harvard professors examined.Four years ago, I was using Reinhart and Rogoff's view to criticize Obama's policy views. He made a mistake by telling the American people the recovery would be swift. Unfortunately, he was wrong. Should we be surprised? No, it did not matter what the president did in office or who we elected. After a financial crisis it takes a tremendous amount of time for capital markets to liquidate bad assets, home and stock prices to stabilize, and government debt to come under control.
Here we are, five years after the collapse of the housing market. What have we learned? Reinhart and Rogoff were correct once again.
Secondly, we assess how has the US has fared, so far, compared to other advanced economies countries that experienced systemic financial crises in 2007-2008 as well other advanced economies that experienced borderline episodes. Focusing on real per capita GDP, we show (i) the recent crises patterns confirm our earlier result that the countries that recently suffered systemic financial crises have generally fared quite poorly compared to countries where the financial problem was less severe, that is, borderline, and (ii) although tracking worse than the countries that did not have systemic financial crises, the United States output performance is, in fact, among the best of those that did.For more information, Rogoff did an interview here.
Ezra Klein has a nice write up here.
Friday, October 5, 2012
Comparing Household Survey with Payroll Numbers
A quick addition to the last post. One of the concerns was the large difference between the payroll numbers (114,000) and household survey numbers (873,000) (for a detailed definition check here). I am simply going to point out that the difference is not that big comparing to previous periods. Here is a graph showing the difference in the month-to-month change in the employment data where I have taken the difference between the household survey data and the payroll data.


As expected, the graph still shows a lot of noise and in absolute terms 2012 does not appear to be an anomaly.
| Month | Difference in Housing Survey and Payroll |
| 2000-01-01 | 1788.00000 |
| 1960-04-01 | 932.00000 |
| 1948-04-01 | 931.00000 |
| 1990-01-01 | 913.00000 |
| 2003-01-01 | 896.00000 |
| 2002-02-01 | 883.00000 |
| 2001-09-01 | 848.00000 |
| 2012-09-01 | 759.00000 |
| 1954-02-01 | 725.00000 |
| 1983-08-01 | 708.00000 |
| 1991-04-01 | 669.00000 |
| 1953-01-01 | 665.00000 |
| 1960-11-01 | 659.00000 |
| 1948-06-01 | 652.00000 |
| 2002-09-01 | 652.00000 |
| 1970-10-01 | 617.00000 |
| 1983-06-01 | 613.00000 |
| 1956-07-01 | 609.00000 |
BLS Numbers
All of the talk today has been over the recent unemployment numbers. The unemployment rate fell from 8.1% to 7.8% and employment increased by 873,000. With these numbers came the conspiracies (google Jack Welch). Without going into a lot of details about the conspiracies, I'm going to post two graphs that will hopefully end this debate. Here is the first graph that simply compares month-to-month change in employment reported by the household survey.

First thing one is likely to notice is the considerable noise in the data. The next thing you will likely notice is the spike that occurred in January of 2000. During this month the economy added 2 million jobs. In fact you will likely notice that April of 1960 and January of 1990 also included large spikes in employment. In 2012 there were two employment spikes, the first in February (went largely unnoticed) and then in September. The economy added 847,000 and 873,000 jobs, respectively. These number also compared to those posted in 1983. In June of 1983 the economy added 991,000 jobs and the May of 1984 added another 857,000. Both 2012 and 1983-4 are very similar in that they follow large periods of declines in the employment numbers.
Here is a table showing the months with the most change in employment levels:
| Month | Change in Employment |
| 2000-01-01 | 2036 |
| 1960-04-01 | 1286 |
| 1990-01-01 | 1251 |
| 1983-06-01 | 991 |
| 2003-01-01 | 991 |
| 1948-06-01 | 889 |
| 2012-09-01 | 873 |
| 1984-05-01 | 857 |
| 1950-04-01 | 855 |
| 2012-01-01 | 847 |
| 1959-12-01 | 811 |
| 1950-08-01 | 796 |
| 1973-02-01 | 751 |
In the second graph, we are simply looking at the percent change in the employment numbers relative to the previous month. Here we see that the two months in 2012 saw employment increase by a little more than 0.6%. Relative to history, there are 48 months in the last 65 years that had a faster growth in the employment numbers. Compared to 1983 these numbers are considerably lower. In 1983-4 the two months added employment at rates of 0.82% and 1%. Conspiracy? Doubtful.
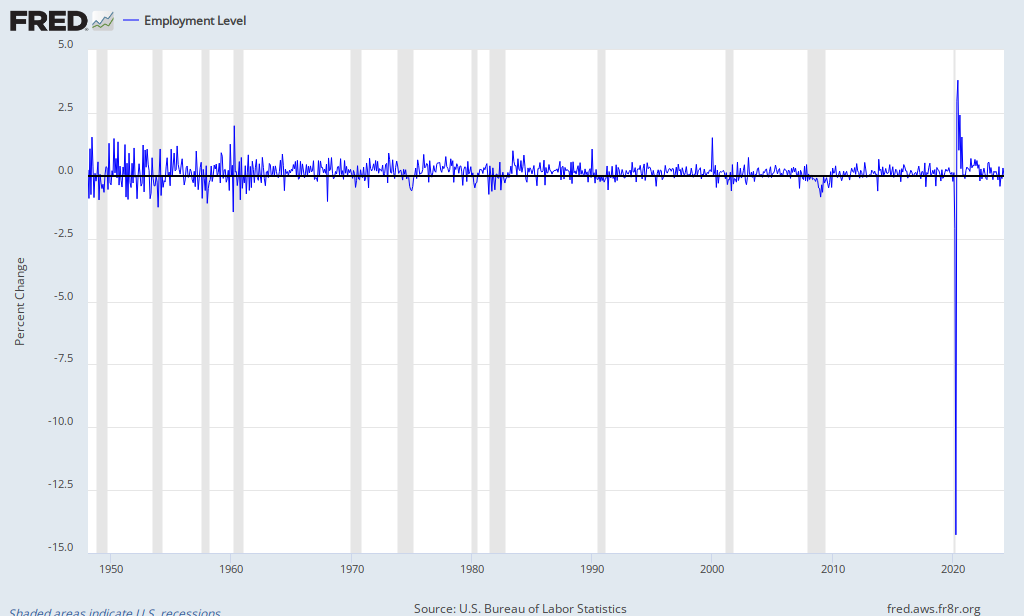
| Month | % Change in Employment |
| 1960-04-01 | 1.988465047 |
| 1948-06-01 | 1.536626681 |
| 2000-01-01 | 1.513495833 |
| 1950-04-01 | 1.481083703 |
| 1950-08-01 | 1.349129676 |
| 1949-11-01 | 1.292147584 |
| 1959-12-01 | 1.256779792 |
| 1951-03-01 | 1.240341261 |
| 1952-09-01 | 1.222612477 |
| 1955-07-01 | 1.184830288 |
| 1951-12-01 | 1.104686142 |
| 1948-04-01 | 1.075063724 |
| 1954-02-01 | 1.06457417 |
| 1990-01-01 | 1.061699058 |
| 1953-01-01 | 1.059815599 |
| 1955-01-01 | 1.059618072 |
| 1952-11-01 | 1.024412958 |
| 1983-06-01 | 0.994560527 |
| 1957-02-01 | 0.982210209 |
| 1959-03-01 | 0.915457572 |
| 1955-04-01 | 0.903812086 |
| 1973-02-01 | 0.903067544 |
| 1951-07-01 | 0.899027172 |
| 1964-04-01 | 0.862382386 |
| 1976-01-01 | 0.848093233 |
| 1961-06-01 | 0.831181531 |
| 1984-05-01 | 0.821384757 |
| 1959-04-01 | 0.779560272 |
| 1977-11-01 | 0.761939561 |
| 1962-08-01 | 0.729509799 |
| 1960-11-01 | 0.72677962 |
| 2003-01-01 | 0.726401126 |
| 1968-05-01 | 0.722594989 |
| 1954-09-01 | 0.716756052 |
| 1953-06-01 | 0.716170373 |
| 1968-02-01 | 0.708165997 |
| 1971-07-01 | 0.695811166 |
| 1950-06-01 | 0.687138741 |
| 1969-02-01 | 0.679643252 |
| 1983-11-01 | 0.676212037 |
| 1955-12-01 | 0.675024108 |
| 1978-04-01 | 0.674370746 |
| 1962-02-01 | 0.650450778 |
| 1973-03-01 | 0.643531319 |
| 1973-06-01 | 0.634391834 |
| 1975-07-01 | 0.631480288 |
| 1964-02-01 | 0.620545319 |
| 1986-01-01 | 0.620056184 |
| 2012-09-01 | 0.614351764 |
| 1965-07-01 | 0.612460401 |
| 1972-01-01 | 0.606429645 |
| 1969-06-01 | 0.604557433 |
| 1984-02-01 | 0.603676321 |
| 1967-04-01 | 0.603221721 |
| 2012-01-01 | 0.601605228 |
Thursday, September 20, 2012
The Importance of Central Bank Credibility
As much as a tend to shy away from posts made by Krugman (he is too political for me), he hits the nail on the head here. Monetary policy works best when the public believes the Fed's credibility and they are committed to maintaining stable inflation. The Fed needs
the public to trust them. Given the current state of politics in the Congress, we need monetary policy more than ever. The constant Fed bashing by the Republicans is
not helping. There have been a number of examples where Mitt Romney has gone out of his way to bash the Fed. It is one thing to bash the Fed using credible numbers. It is another to bash the Fed with blatant lies. In the secret video that was released, there was a part where Romney discussed recent treasury purchases by the Fed. Here is what Romney said:

[A]s soon as the Fed stops buying all the debt that we’re issuing—which they’ve been doing, the Fed’s buying like three-quarters of the debt that America issues. He said, once that’s over, he said we’re going to have a failed Treasury auction, interest rates are going to have to go up. We’re living in this borrowed fantasy world, where the government keeps on borrowing money.Without question, if the Fed were buying three-quarters of debt that America issues we would be in serious trouble. So good thing they are not. Here is graphing showing the amount of government debt held by the public, the amount of government debt held by the Fed, and the ratio of the two.

As we can see in the red line (ratio of debt held by the Fed to total public debt) the most the Fed has ever held is a little more than 60%. This happen at one point back in the middle of 2011 following the announcement of operation twist (it was entirely expected). When Romney gave his talk, the Fed was only purchasing 20% of the government issued debt. As of today we can see the Fed is currently no longer purchasing government debt.
Again, the issue here is that there are a number of people who believe Romney when he states, "Fed’s buying like three-quarters of the debt
that America issues," it is simply incorrect. He later predicts we would have a failed treasury auction once they stop by debt. Well, we are waiting.
Monday, August 27, 2012
Ben Bernanke's Jackson Hole speech could be a letdown - Aug. 22, 2012
The Fed can do a lot to help the economy, but they can only do so much. With the uncertainty in Washington the Fed is rather limited. More than anything we need Congress to pass policies that last more than 1-year. We have the Bush tax cuts and payroll tax cuts expiring at the end of the year. There is further uncertainty over changes in the tax system.
Investors and economists agree: No QE3 - Aug. 26, 2012
Will the Fed announce QE3. My guess, they will do it in November.
Thursday, August 23, 2012
Saturday, August 18, 2012
Thursday, August 9, 2012
Political economics: The Fed on the ballot | The Economist
Interesting arguments for why QE3 will be launched this September. Regardless of the election cycle, I suspect QE3 will come in September following big fed meetings in Jackson Hole and the next FOMC meeting.
http://www.economist.com/blogs/freeexchange/2012/08/political-economics-0?fsrc=scn/fb/wl/bl/fedbontheballot
http://www.economist.com/blogs/freeexchange/2012/08/political-economics-0?fsrc=scn/fb/wl/bl/fedbontheballot
Wednesday, August 8, 2012


Post Crisis Growth
Here is image from Reinhart and Rogoff. In terms of the US crisis, what should we expect in terms of growth?


Saturday, August 4, 2012
Wednesday, August 1, 2012
FOMC Policy Statement
The Federal Reserve's policy statement has been released. Here is the interesting stuff that carried over from June:
From June: Information received since the Federal Open Market Committee met in April suggests that the economy has been expanding moderately this year.
From August: Information received since the Federal Open Market Committee met in June suggests that economic activity decelerated somewhat over the first half of this year.
Overall, not a whole lot was done. They left the door open for more policy down the road. It will be interesting to see if the Fed does anything prior to the election. They have a big conference in Jackson Hole, Wyoming in the end of August. Last year they announced operation twist in September following this meeting. Here is a list of what can be done.
The Committee also decided to continue through the end of the year its program to extend the average maturity of its holdings of securities as announced in June, and it is maintaining its existing policy of reinvesting principal payments from its holdings of agency debt and agency mortgage-backed securities in agency mortgage-backed securities. The Committee will closely monitor incoming information on economic and financial developments and will provide additional accommodation as needed to promote a stronger economic recovery and sustained improvement in labor market conditions in a context of price stability.Read over this statement and compare it with the last statement. You will notice paragraphs two and three have remained unchanged.
From June: Information received since the Federal Open Market Committee met in April suggests that the economy has been expanding moderately this year.
From August: Information received since the Federal Open Market Committee met in June suggests that economic activity decelerated somewhat over the first half of this year.
Overall, not a whole lot was done. They left the door open for more policy down the road. It will be interesting to see if the Fed does anything prior to the election. They have a big conference in Jackson Hole, Wyoming in the end of August. Last year they announced operation twist in September following this meeting. Here is a list of what can be done.
Monetary Policy Today
I think this is a very good proposal. Here's why:
Right now interest rates on a 30-year mortgage are around 3.25%. Now, I purchased a home in April of 2009 and our interest rate was 4.625. Last October, we refinanced and took out a 20-year mortgage at 3.75%. We refinanced after the announcement of QE1 and operation twist. I follow the markets fairly closely and both times felt confident that interest rates would not, could not go lower. Fast forward less than a year and interest rates have dropped again. I could take out a 20-year (or 30-year) mortgage today at 3.25%. Again, I find myself asking, are rates going to be lower. Is it worth the hassle of doing another refinance. What if rates go down again? What if my appraisal comes in much lower than previously?
Now if I know interest rates are going to stay at 2.5% for the next year the uncertainty is removed and further it will help spur home sales. I can take my time with my refinance, get my paper work together, and not worry about a low appraisal.
Now, does it make a difference? Suppose you were looking at financing a home and needed to borrow $300,000 under a 30-year note here are your payments:
4.625% .....$1542.42
3.75%........$1389.25
3.25%........$1305.62
2.50%........$1185.36
As you can see, the payments drop significantly, anyone else think that would be a huge boost to the economy? One, side note. A number of people are unable to refinance because they are underwater or have lost a considerable amount of equity. If you do not have 20% equity you must pay mortgage insurance. That could add an additional $100-150 per month to your mortgage. The government needs to change this. If someone has been a good borrower and not missed a payment over a significant period (3+ years), they should not be required to have mortgage insurance. The government should accept this risk, its the least they can do to homeowners.
Right now interest rates on a 30-year mortgage are around 3.25%. Now, I purchased a home in April of 2009 and our interest rate was 4.625. Last October, we refinanced and took out a 20-year mortgage at 3.75%. We refinanced after the announcement of QE1 and operation twist. I follow the markets fairly closely and both times felt confident that interest rates would not, could not go lower. Fast forward less than a year and interest rates have dropped again. I could take out a 20-year (or 30-year) mortgage today at 3.25%. Again, I find myself asking, are rates going to be lower. Is it worth the hassle of doing another refinance. What if rates go down again? What if my appraisal comes in much lower than previously?
Now if I know interest rates are going to stay at 2.5% for the next year the uncertainty is removed and further it will help spur home sales. I can take my time with my refinance, get my paper work together, and not worry about a low appraisal.
Now, does it make a difference? Suppose you were looking at financing a home and needed to borrow $300,000 under a 30-year note here are your payments:
4.625% .....$1542.42
3.75%........$1389.25
3.25%........$1305.62
2.50%........$1185.36
As you can see, the payments drop significantly, anyone else think that would be a huge boost to the economy? One, side note. A number of people are unable to refinance because they are underwater or have lost a considerable amount of equity. If you do not have 20% equity you must pay mortgage insurance. That could add an additional $100-150 per month to your mortgage. The government needs to change this. If someone has been a good borrower and not missed a payment over a significant period (3+ years), they should not be required to have mortgage insurance. The government should accept this risk, its the least they can do to homeowners.
Audit the Fed
As always, Ron Paul wants to audit the Fed. Here is an overview of his bill. This article sums up my views nicely. Ron Paul wants the Federal Reserve to disclose all of their loans to banks through the discount window. Given our recent discussion on adverse selection what would happen if the Fed had to publicly announce who was borrowing from the Fed and selling securities through the open market operations?
Break Up the Big Banks
One of the men responsible for the creation of banks too big to fail, now wants to break them up.
To me, the issue is not about breaking up the larger banks. These banks are going to all be technologically advanced and very difficult to breakup, let alone regulate. The issue is about the 6,200 banks that cannot compete electronically and the subsection of these banks that are still facing issues of solvency.
Subscribe to:
Posts (Atom)